Evaluation of Zinc Sulfate and Canagliflozin as Therapeutic Agents in a Type-2 Diabetes Rat Model
Ayela Eman Zia1, Abdul Mudabbir Rehan2, Tehreem Zulfiqar3, Nazia Rashid4, Fariha Ahmed Khan5, Usman Aslam6
1CMH Lahore Medical College and Institute of Dentistry, Lahore; 2Nishtar Medical University, Multan; 3Services Institute of Medical Sciences SIMS, Lahore; 4Fatima Jinnah Medical University, Lahore; 5Al-Aleem Medical College, Lahore; 6Akhtar Saeed Medical and Dental College, Lahore
Objectives: This study aimed to assess the synergistic effects of Zinc Sulphate and Canagliflozin in a combination therapy on a type-2 diabetic model of rats.
Methodology: The study utilized a rat model, inducing type-2 diabetes through a high-fat diet and streptozotocin injection. Rats were divided into six groups: normal control, disease control, zinc-treated, canagliflozin-treated and two groups receiving combination therapy with different doses. Parameters such as fasting blood glucose and serum insulin were measured over 8 weeks.
Results: Blood glucose and serum insulin levels were significantly altered in diabetic groups but showed improvement with zinc and canagliflozin treatment. HOMA-IR and HOMA-B changes in diabetic rats were mitigated with both agents individually and exhibited further improvement in combination therapy groups.
Conclusion: The combination of zinc and canagliflozin demonstrated superior efficacy in improving blood glucose, insulin levels and Insulin resistance compared to individual treatments. This suggests a potential synergistic effect of the two agents in managing type-2 diabetes. Further studies are warranted to explore the underlying mechanisms and potential clinical applications of this combination therapy.
Keywords: Zinc sulphate, Insulin, Canagliflozin, Diabetes.
Diabetes mellitus (DM) is a metabolic disorder characterized by elevated blood sugar levels, mostly caused by deficiencies in insulin secretion, insulin action or both. Over the past twenty years, global data have indicated a significant increase in the prevalence of diabetes. The significant healthcare costs associated with diabetes, particularly in poorer nations, impose a substantial economic burden.1,2 In Pakistan, the incidence of diabetes is on the rise, with around 19.4 million cases reported in 2019. If this upward trend continues, it is projected that the number of cases will reach 26.1 million by 2045. Consequently, diabetes has emerged as a significant health issue at both local and global levels.3,4 The current therapeutic choices effectively manage hyperglycemia, but the adverse effects associated with these treatments reduce patient adherence. Therefore, there is a need for an alternative option that can achieve optimal glycemic control while
minimizing negative effects.5 Diabetes mellitus is a significant risk factor for the progression of atherosclerosis. The disrupted lipid profile observed in individuals with diabetes is mainly caused by heightened insulin resistance and hyperinsulinemia, both of which are prevalent in Diabetes Mellitus. 6
Canagliflozin is classified as an SGLT-2 inhibitor, which helps increase the excretion of glucose in urine by reducing its reabsorption at the proximal tubule. This leads to a decrease in the renal glucose threshold. It is well-tolerated by the body and has the added advantage of reducing blood pressure and body weight.7 Zinc supplementation has the potential to restore normal blood sugar levels and correct metabolic abnormalities associated with diabetes. Additionally, it enhances insulin sensitivity and alters the abnormal tissue structure of the pancreas in individuals with diabetes. Several studies suggest that the inclusion of zinc in the diet has demonstrated advantageous outcomes in individuals with diabetes and Insulin resistance.8,9 This study aimed to assess the individual and combined effects of zinc and canagliflozin on type-2 diabetes mellitus. The objective was to determine whether the combination treatment was superior to each treatment used alone. If proven, this could potentially lead to the simultaneous administration of both substances to reduce the therapeutic dosage and minimize the side effects of canagliflozin.
Research Methodology: Conducted an animal experimental investigation.
Location: The study took place in the Department of Pharmacology, KEMU and PGMI, Lahore.
Sampling Method: Simple random sampling.
Sample Size: A total of forty-eight rats were randomly assigned to six groups using a lottery approach.
Study duration: 1 year.
Inclusion Criteria: Male Sprague-Dawley rats with a weight ranging from 120g to 180g.
Exclusion Criteria: Rats exhibiting symptoms of any illness.
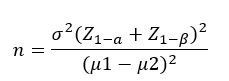
Sample Size: Sample size was calculated by taking serum insulin as a parameter and keeping a 95% confidence level, 90% power of test, 5% level of significance and taking the mean value of serum Insulin with canagliflozin group as 0.401 ±0.08010 and with zinc sulphate as 0.56 ±0.03.11
The following formula was used for calculating the sample size:
A total of 48 male albino rats, which were in good health and adults, were acquired from UVAS (University of Veterinary and Animal Sciences) and housed in the animal facility at PGMI (Post-Graduate Medical Institute) in Lahore. The animals were randomly allocated into 6 homogeneous groups, each consisting of 8 rats. The rats were subjected to ambient temperature of 22 ± 2 °C and 50 ± 5 % humidity, while being exposed to natural day and night cycles, throughout the experiment. They were provided with unrestricted access to rat feed and water. A period of seven days was allocated to them for acclimatization prior to the commencement of the trial.
Preparation of Dosages: The dose for each rat was determined as follows: 10mg/kg/day of canagliflozin10 and 30mg/kg/day of zinc sulphate 11 were measured and diluted in 1ml of distilled water. A high-fat diet was formulated by adding 1.5 g of cholesterol,12 1 g of sodium deoxycholate, and 8 ml of coconut oil to every 100g of regular rat chow.13 The hyperlipidemic rats were administered an intraperitoneal injection of streptozotocin at a dosage of 35mg/kg on day 22. The streptozotocin was dissolved in a 0.1M sodium citrate buffer with a pH of 4.5. The buffer was made by combining 46.5 ml of citric acid with 3.5 ml of sodium citrate solution and diluting it to a total volume of 100 ml with distilled water.14 One week after injecting streptozotocin, blood samples were collected from the lateral tail vein and analyzed using a glucometer to measure blood glucose levels. Rats with blood glucose levels over 180 mg/dl were classified as diabetic.
The HFD/STZ rat model is a laboratory-created model used to simulate type-2 diabetes. The method involves administering rats to a diet high in fat to induce insulin resistance. Subsequently, the rats are administered streptozotocin, which results in a more significant deterioration of pancreatic beta cell function.15
Animal grouping: A total of forty-eight rats were randomly allocated into six groups using a lottery approach, with each group consisting of eight rats. The groups were designated as A, B, C, D, E, and F. Every individual in the group was confined within an individual enclosure made of iron. The rats in group A, which served as the normal control group, were provided with a standard rat diet (normal rat chow) for the whole 8-week duration of the study. Rats in groups B, C, D, E, and F were administered a high-fat diet for a duration of 8 weeks. After 3 weeks, they were also given streptozotocin to induce type-2 diabetes. The rats in group B, which served as the disease control group, were only administered streptozotocin to induce diabetes. Rats in group C received oral administration of zinc sulphate from the 4th to the 8th week after diabetes was induced. Group D rats were orally fed canagliflozin from the 4th to the 8th week after diabetes was induced. Rats in group E received oral administration of canagliflozin (at a dosage of 10mg/kg/day) and zinc sulphate from the 4th to the 8th week after diabetes was induced. Rats in group F were orally administered a half dose (5mg/kg/day) of canagliflozin and zinc sulphate from the 4th to the 8th week after diabetes was induced. The rats were euthanized at the end of week 8, precisely 24 hours after the last treatment was given.
Data Collection Procedure:
- Fasting Blood glucose: Blood glucose was measured at baseline (day 0), after induction of diabetes (end of 4th week) and after the treatment (end of 8th week) using a glucometer (Accu-Check by Roche). The blood was drawn after 12 hours of fasting, through the lateral tail vein puncture.14
- Blood sample collection:
Each sample was collected after 12 hours of overnight fasting of rats. The rats were anaesthetized with inhaled chloroform for about 30-40 seconds at week 0, week 4 and week 8. About 1-1.5 millilitres of whole blood was drawn by the cardiac puncture using 3ml disposable syringes. Samples were poured into yellow-capped serum glass vials and allowed to clot at room temperature. Then these samples were centrifuged in a centrifuge machine for about 10 minutes at the speed of 3000 rpm to obtain sera, which were then separated in serum cups. The sera were stored for further analysis at -20ºC.11 Serum Insulin was estimated by ELISA, using an ELISA kit for Insulin by Glory Science Company, USA.16 Before the performance, the cuvettes and the frozen samples were warmed to the desired temperature. - Measurement of Insulin resistance and sensitivity: Insulin resistance and sensitivity were measured by the following parameters, which were calculated from the obtained values of the serum tests of fasting glucose and insulin:
- HOMA-IR: HOMA-IR represents the level of insulin resistance produced by hyperglycemia. It is calculated as follows.17
Fasting insulin (µIU/ml) x fasting glucose (mmol/L) 22.5 - HOMA-B: (β-cell function percentage) is calculated as
20 x fasting insulin (µIU/ml)18
Fasting glucose (mmol/L) - 3.5
Homeostatic Model Assessment of Insulin Resistance (HOMA-IR) and Homeostatic Model Assessment of beta cell function (HOMA-B) are surrogate markers of insulin sensitivity that are derived from fasting blood glucose and insulin concentrations 17
Data Analysis: Data was analyzed by using Statistical Package for Social Studies (SPSS) software for Windows (version 23.0) and graph pad Prism (version 8). Quantitative data was expressed as Mean ± S.D. Mean plots were used for graphical presentation to see the changes in the parameters. The data was evaluated by one-way analysis of variance (ANOVA) followed by Tukey’s multiple comparison tests to compare results among individual groups. T-test was used to study the significance of results within groups at week 0, week 4 and week 8. A P-value of less than 0.05 was considered significant.
1. Blood Glucose (mg/dl):
All the rats were normoglycemic at the start, i.e., week 0. The rats in group A remained normoglycemic throughout the study, having blood glucose 110.25+11.99 at week 0, 108.38+22.83 at week 4 and 110.25+15.63 at the blood. Blood glucose of group-B was 113.00+11.46 at week 0 and after inducing diabetes, it increased to 380.00+38.63 and 399.25+52.04 at week 4 and 8 respectively. The blood glucose of group-C was 112.50±12.58 at week 0 and 340.38±40.73 at week 4 due to diabetes. It decreased to 192.00±31.76 at week 8 due to treatment with zinc. Blood glucose of group-D was 113.38±9.81 and 321.63±46.94 at week 0 and 4 respectively. It became 173.38±28.59 at week 8 after giving canagliflozin. Similarly, blood glucose of group-E was 114.00±14.28 at week 0. It increased to 329.25±41.66 at week 4 due to induction of diabetes and reduced to 156.00±32.23 at week 8 after giving combined treatment of zinc with full dose of canagliflozin. The rats of group F had fasting glucose of 112.00±12.59 at week 0 which increased to 326.75±39.30 at week 4 because of diabetes and decreased to 155.38±22.60 at week 8 after completing the treatment with zinc and half dose of canagliflozin. The difference was significant among groups at week 4 and week 8 with a p-value of < 0.001 each.
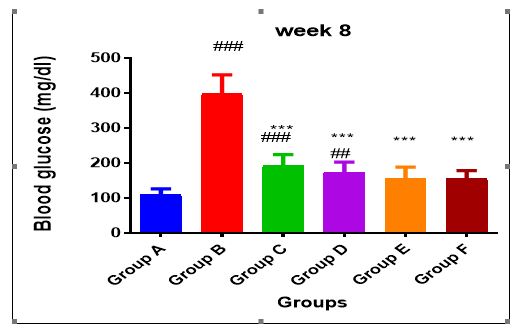
Figure 1: Comparison of mean blood glucose (mg/dl) of groups A, B, C, D, E and F at week 8.
2. Serum Insulin (µIU/ml):
Serum insulin level was almost similar in group A, B, C, D, E and F at day 0. The serum insulin level of group A was 13.04+2.96, 13.37+3.30 and 13.91+3.30 at weeks 0, 4 and 8 respectively. Serum insulin levels of groups B, C, D, E and F decreased from 11.56+2.53, 10.75+2.04, 9.91+2.71, 9.74+3.09 and 11.17+1.83 at week 0 to 2.97+0.62, 2.67+0.45, 2.91+0.54, 2.84+0.65 and 2.76+0.38 at week 4 respectively due to induction of diabetes. At week 8, the serum insulin level of group B was 3.20+0.52, whereas the treatment groups showed a rise in the level of serum insulin, group C had 10.64+2.45 at week 8 after giving zinc. The serum insulin levels of groups D, E and F were 7.71+1.73, 9.00+3.49 and 9.26+2.37 at the end of week 8. No significant difference was observed among the groups at week 0 with a p-value 0.138 but on weeks 4 and 8, the difference was significant among all the groups with a p-value <0.001.
Table-1: Comparison of mean HOMA-IR (mg/dl) among groups A, B, C, D, E and F (ANOVA) |
|||||||
HOMA IR |
Group-A |
Group-B |
Group-C |
Group-D |
Group-E |
Group-F |
P |
Mean±SD |
Mean±SD |
Mean±SD |
Mean±SD |
Mean±SD |
Mean±SD |
||
Week-0 |
3.52±0.74 |
3.22±0.77 |
2.96±0.48 |
2.76±0.75 |
2.67±0.63 |
3.05±0.37 |
0.118 |
Week-4 |
3.39±0.45 |
2.77±0.58 |
2.21±0.23 |
2.28±0.34 |
2.26±0.30 |
2.25±0.51 |
<0.001 |
Week-8 |
3.72±0.67 |
3.11±0.37 |
4.98±1.19 |
3.28±0.79 |
3.28±0.71 |
3.47±0.64 |
<0.001 |
F-test |
.966 |
1.553 |
33.763 |
4.69 |
8.59 |
12.37 |
|
p-value |
0.405 |
0.246 |
0.001 |
0.028 |
0.004 |
0.001 |
|
Table-2: Comparison of mean HOMA-B among groups A, B, C, D, E and F (ANOVA) |
|||||||
HOMA-B |
Group-A |
Group-B |
Group-C |
Group-D |
Group-E |
Group-F |
P |
Mean±SD |
Mean±SD |
Mean±SD |
Mean±SD |
Mean±SD |
Mean±SD |
||
Week-0 |
107.60±48.38 |
89.16±39.22 |
84.31±31.89 |
74.36±26.15 |
87.63±82.26 |
90.49±41.17 |
.845 |
Week-4 |
145.34±96.40 |
3.44±0.90 |
3.60±1.04 |
4.22±1.34 |
4.02±1.44 |
3.79±0.48 |
<.001 |
Week-8 |
142.98144.28± |
3.56±1.09 |
32.82±17.01 |
27.43±11.77 |
43.65±36.63 |
40.21±20.75 |
<.001 |
F-test |
.456 |
37.77 |
30.59 |
37.458 |
8.002 |
24.125 |
|
p-value |
.643 |
<.001 |
<.001 |
<.001 |
.005 |
<.001 |
|
3. HOMA-IR:
Calculation of HOMA-IR indicated that insulin resistance was less in all the diabetes induced groups including the disease control group (group B) than the normal control group (group A) at week 4. However, after giving the treatment, it tends to increase in all the treatment groups (groups C, D, E and F) at week 8. The difference was significant at week 4 and week 8.
4. HOMA-B:
HOMA-β estimation showed it to be markedly decreased in all the diabetic induced groups (group B, C, D, E and F) as compared to the normal control group (group A) at week 4. After giving the treatment, it significantly increased in the treatment groups, C, D, E and F as compared to the disease control group B at week 8 (Table-2).
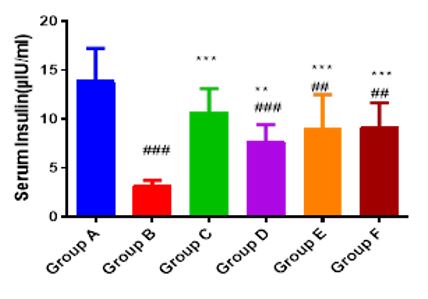
Figure 2: Comparison of mean serum insulin (µIU/ml) of groups A, B, C, D, E and F at week 8.
Blood glucose and Serum Insulin: At the start (week 0), rats in all the groups had blood glucose and serum insulin within the normal range and it was statistically insignificant. After the induction of diabetes by injecting STZ to high fat diet fed rats, all rats of the experimental groups ( B, C, D, E and F ) developed diabetes at week 4, as evident by elevated levels of blood glucose and decreased levels of insulin, which were statistically significant in comparison to the normal control group A, as supported by the previous work.19 The positive control group B continued to show high glucose and low insulin levels at week 8 in comparison with the negative control group A. Rest of the groups (C, D, E and F) which were treated with zinc and canagliflozin showed some restoration of the blood glucose and serum insulin levels at week 8. This conforms to the previous studies that have demonstrated the glucose lowering and insulin restoring activities of zinc in the diabetic rats.16 Also in the recent studies, when canagliflozin was given to ZDF rats, it markedly reduced blood glucose due to excessive excretion of glucose in the urine by inhibiting SGLT-2 transporter, whereas no significant increase in plasma insulin levels was seen, because canagliflozin controls hyperglycemia which is independent of the action of insulin.20 Results of group E and F were statistically significant in comparison to positive control and rats in both groups displayed marked improvement in blood glucose and serum insulin levels. These groups received combined treatment with zinc and canagliflozin.
HOMA-IR and HOMA-B: Homeostatic model assessment (HOMA) is a way through which we can assess the function of β-cell and insulin resistance (IR) directly from the basal (fasting) blood glucose and serum insulin or C-peptide concentrations. The mean values of HOMA-IR and HOMA-B were found to be almost the same and statistically insignificant at the start of the study (week 0). Both were lowered after induction of diabetes. HOMA-IR was reduced due to deficient insulin production in response to hyperglycemia by the β-cells, most of which were reduced in number or destroyed by STZ. This is supported by previous studies in which subjects having severely impaired or reduced β-cell function showed inappropriate results of HOMA-IR.21 After giving treatment, there was also no significant difference in the HOMA-IR levels due to the reason mentioned before and canagliflozin itself does not affect the HOMA-IR significantly as studied earlier.22 On the contrary, HOMA-B index, which represents a measure of the β-cell function along with the glucose stimulated insulin secretion, is decreased in diabetes,17 as seen in our present study, where there is a significant lowering of HOMA-B in diabetes-induced rats at week 4. This explains the decreased insulin secretion observed in diabetes. In the present study, treatment with either canagliflozin or zinc protected the β-cells from the progressive damage and resulted in restoration of some function of the β-cell and insulin secretion, thereby increasing HOMA-B to some extent but the difference was not significant. However, in some of the studies, sustained treatment with canaglifllozin led to an improvement in the measures of functioning beta-cell in type 2 diabetic patients.23 Zinc is well-known for its insulinomimitic activity which accounts for the rise in HOMA-B which has been established in the previous work, in which zinc supplemented diet of STZ-induced diabetic rats caused a significant alteration in HOMA-B.24
This work has shown that the simultaneous use of zinc and canagliflozin has had a more powerful impact on reducing high blood sugar and improving insulin in a rat model of type 2 diabetes compared to using either of them individually. The combination therapy of low and high dose canagliflozin with zinc had a similar impact.
Suggestion: Combining canagliflozin with zinc at a lower dosage can successfully reduce its side effects while achieving superior outcomes compared to using canagliflozin alone. This study demonstrates that the inclusion of zinc in an oral hypoglycemic medication (canagliflozin) significantly improves glycemic management in individuals with diabetes mellitus.
- Goyal Y, Verma AK, Bhatt D, Rahmani AH, Dev K. Diabetes: perspective and challenges in modern era. Gene Reports. 2020 Sep 1; 20:100759. https://doi.org/10.1016/j.genrep.2020.100759
- Nanditha A, Ramachandran A, Snehalatha C, Chan JC, Chia KS, Shaw EJ, et al. Diabetes in Asia and the Pacific: Implications for the Global Epidemic. Diabetes care. 2016; 39(3):472-85. https://doi.org/10.2337/dc15-1536
- International Diabetes Federation (IDF). IDF Diabetes Atlas, 2019; 9th Edition. PMID: 35914061.
- Bashir, S., & Raza, S. I. Genetics of type 2 diabetes mellitus in Pakistani population: A comprehensive review. Pakistan Journal of Medical Sciences 2019; 35(2), 528-534.
- Chaudhury A, Duvoor C, Reddy Dendi VS, Kraleti S, Chada A, Ravilla R, et al. Clinical review of antidiabetic drugs: Implications for type 2 diabetes mellitus management. Front Endocrinal. 2017; 8(6):1-12. https://doi.org/10.3389/fendo.2017.00006
- Gupta M, Tummala R, Ghosh RK, Blumenthal C, Philip K, Bandyopadhyay D, Ventura H, Deedwania P. An update on pharmacotherapies in diabetic dyslipidemia. Progress in cardiovascular diseases. 2019 Jul 1;62(4):334-41. https://doi.org/10.1016/j.pcad.2019.07.006
- Rosenthal N, Meininger G, Ways K, Polidori D, Desai M, Qiu R, et al. Canagliflozin: a sodium glucose co-transporter 2 inhibitor for the treatment of type 2 diabetes mellitus. Annals of the New York Academy of Sciences. 2015; 1358:28-43. https://doi.org/10.1111/nyas.12852
- Susmita Barman, Srinivasan K. Zinc supplementation alleviates hyperglycemia and associated metabolic abnormalities in streptozotocin-induced diabetic rats. Can J Physiol Pharmacol. 2016; 94:1356-65. https://doi.org/10.1139/cjpp-2016-0084
- Burki ZG, Hussain M, Burki S, Farooqi WA, Zeb A, Ahmad S. Effect of zinc supplementation on serum fasting blood sugar and HbA1c in adult diabetics on oral hypoglycemic agents. gjms. 2017;15(1):8-11.
- 10.Morsy MA, Khalaf HM, Rifaai RA, Bayoumi AM, Khalifa EM, Ibrahim YF. Canagliflozin, an SGLT-2 inhibitor, ameliorates acetic acid-induced colitis in rats through targeting glucose metabolism and inhibiting NOX2. Biomedicine & Pharmacotherapy. 2021 Sep 1; 141:111902
- Nazarizadeh A, Asri-Rezaie S. Comparative study of antidiabetic activity and oxidative stress induced by zinc oxide nanoparticles and zinc sulfate in diabetic rats. AAPS Pharm Sci Tech. 2016; 17(4):834-43. https://doi.org/10.1208/s12249-015-0405-y12.
- Kottaisamy CP, Raj DS, Prasanth Kumar V, Sankaran U. Experimental animal models for diabetes and its related complications—a review. Laboratory animal research. 2021 Aug 24;37(1):23. https://doi.org/10.1186/s42826-021-00101-413.Im YR,
- Hunter H, de Gracia Hahn D, Duret A, Cheah Q, Dong J, Fairey M, Hjalmarsson C, Li A, Lim HK, McKeown L. A systematic review of animal models of NAFLD finds high‐fat, high‐fructose diets most closely resemble human NAFLD. Hepatology. 2021 Oct;74(4):1884-901. https://doi.org/10.1002/hep.3189714.
- Marie M, Arafa N, Sara Abdullah Mubarak A. Effect of canagliflozin or metformin on metabolic disorders in obese diabetic rats. Afr J Pharm Pharmacol. 2015; 9(46):1071-9. https://doi.org/10.5897/AJPP2015.4455
- 15.Skovso S. Modeling type 2 diabetes in rats using high fat diet and streptozotocin. J Diabetes Investing. 2014; 5(4):349-5 https://doi.org/10.1111/jdi.12235.
- Al-Ali K, Abdel-Fatah HS, El-Badry YA. Dual effect of curcumin–zinc complex in controlling diabetes mellitus in experimentally induced diabetic rats. Biol Pharm Bull. 2016;39(11):1774-80. https://doi.org/10.1248/bpb.b16-00137
- Tharaheswari M, Jayachandra Reddy N, Kumar R, Varshney KC, Kannan M, SudhaRani S. Trigonelline and diosgenin attenuate ER stress, oxidative stress-mediated damage in pancreas and enhance adipose tissue PPAR-gamma activity in type 2 diabetic rats. Mol Cell Biochem. 2014;396(1-2):161-74. https://doi.org/10.1007/s11010-014-2152-x
- 18.Minh HV, Tien HA, Sinh CT, Thang DC, Chen CH, Tay JC, Siddique S, Wang TD, Sogunuru GP, Chia YC, Kario K. Assessment of preferred methods to measure insulin resistance in Asian patients with hypertension. The Journal of Clinical Hypertension. 2021 Mar;23(3):529-37. https://doi.org/10.1111/jch.14155
- 19.Masood S, Rehman AU, Bashir S, El Shazly M, Imran M, Khalil P, Ifthikar F, Jaffar HM, Khursheed T. Investigation of the anti-hyperglycemic and antioxidant effects of wheat bread supplemented with onion peel extract and onion powder in diabetic rats. Journal of Diabetes & Metabolic Disorders. 2021 Jun; 20:485-95. https://doi.org/10.1007/s40200-021-00770-x Oguma T, Kuriyama C, Nakayama K, Matsushita Y, Yoshida K, Kiuchi S, et al. The effect of combined treatment with canagliflozin and teneligliptin on glucose intolerance in zucker diabetic fatty rats. J Pharmacol Sci. 2015;127(4):456-61. https://doi.org/10.1016/j.jphs.2015.03.006
- Altamimi JZ, Alfaris NA, Alshammari GM, Alagal RI, Aljabryn DH, Aldera H, Alkhateeb M, Yahya M. Ellagic acid protects against diabetic cardiomyopathy in rats by stimulating cardiac silent information regulator 1 signaling. J Physiol Pharmacol. 2020 Dec 1;71(6):891-904. https://doi.org/10.26402/jpp.2020.6.12
- Watanabe Y, Nakayama K, Taniuchi N, Horai Y, Kuriyama C, Ueta K, et al. Beneficial effects of canagliflozin in combination with pioglitazone on insulin sensitivity in rodent models of obese type 2 diabetes. PloS one. 2015;10(1): e0116851. https://doi.org/10.1371/journal.pone.0116851
- Polidori D, Mari A, Ferrannini E. Canagliflozin, a sodium glucose co-transporter 2 inhibitor, improves model-based indices of beta-cell function in patients with type 2 diabetes. Diabetologia. 2014;57(5):891-901. https://doi.org/10.1007/s00125-014-3196-x
- Cooper-Capetini V, de Vasconcelos DAA, Martins AR, Hirabara SM, Donato J Jr, Carpinelli AR, Abdulkader F. Zinc Supplementation Improves Glucose Homeostasis in High Fat-Fed Mice by Enhancing Pancreatic β-Cell Function. Nutrients. 2017 Oct 20;9(10):1150. https://doi.org/10.3390/nu9101150

An Official Publication of
Islamabad Medical & Dental College
Vol 13 No (Suppl.)
Address of Correspondence
Ayela Eman Zia
Email:
ayelaemanz@gmail.com
Authors’ Contribution: 1,2Conception; Literature research; manuscript design and drafting; 3,4 Critical analysis and manuscript review; 5,6Data analysis; Manuscript Editing.
Cite this article. Zia AE, Rehan AM, Zulfiqar T, Rashid N, Khan FA, Aslam U. Evaluation of Zinc Sulfate and Canagliflozin as Therapeutic Agents in a Type-2 Diabetes Rat Model. J Islamabad Med Dental Coll. 2024; 13i(Suppl.): 528-535
DOI: https://doi.org/10.35787/jimdc.
v13i(Suppl.).1213